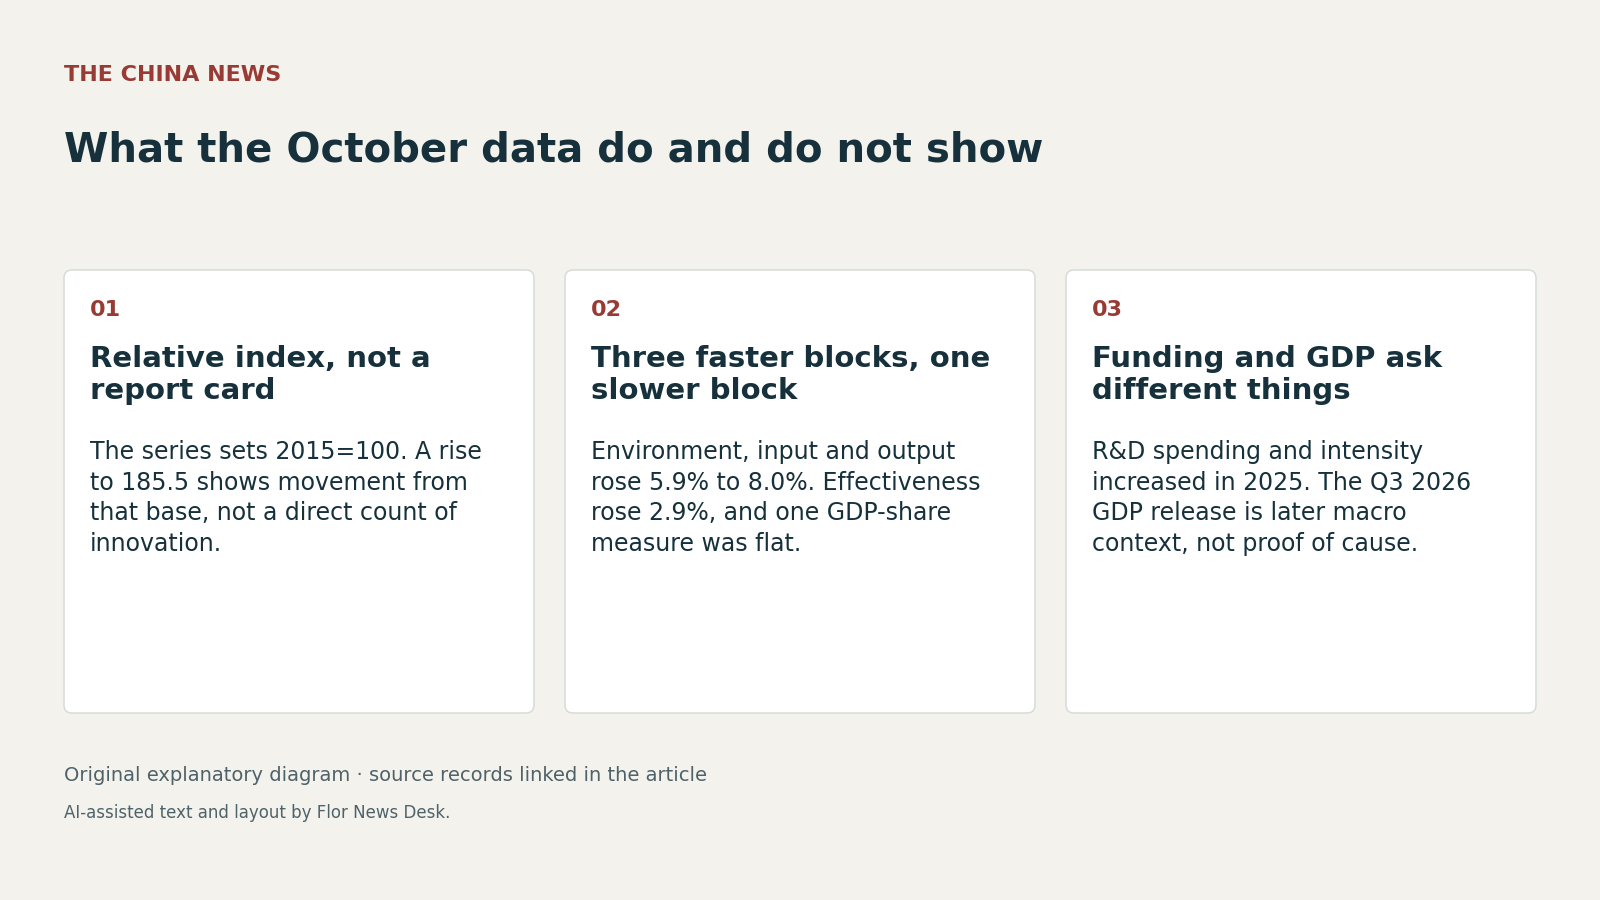
On 23 October, the National Bureau of Statistics reported that China’s 2025 China Innovation Index reached 185.5, up 6.4% from a revised 2024 reading of 174.4, with 2015 set as 100 in the series. NBS index release NBS statistician interpretation That matters less as a headline score than as a reminder of what the measure is: a composite benchmark, not a count of inventions or a direct reading of productivity. The official interpretation also said the increase was 1.1 percentage points faster than in 2024. NBS statistician interpretation
The structure of the index is the more useful signal. In 2025, the environment sub-index rose to 199.9, input to 172.2, output to 233.0 and effectiveness to 137.0; the respective growth rates were 7.5%, 5.9%, 8.0% and 2.9%. NBS index release Read together, those figures show official measures of conditions, spending and patent-related output moving faster than the official measures of economic payoff. The same page says one effectiveness indicator, the patent-intensive industries value-added share of GDP index, was unchanged at 123.9 in both 2024 and 2025, while a high-tech products export-share index edged from 85.6 to 87.2. NBS index release
The largest standout is not a factory result or a sales result. Within the environment block, the index for the share of enterprises receiving the additional pre-tax R&D deduction climbed to 509.4, up 19.1% from 2024. NBS index release By construction, that measure tracks how widely a tax preference is used, so a sharp rise can reflect policy reach as much as firm-level technical advance. The official interpretation reinforces that point indirectly: it says only two of the 18 sub-indicators had double-digit growth in 2025, this tax-benefit measure and high-value invention patents per 10,000 R&D personnel. NBS statistician interpretation
The second of those fast movers fits better with an output story. The index for high-value invention patents per 10,000 R&D personnel rose to 332.2, up 12.1%, which the statistics bureau said was a fourth straight year of double-digit growth. NBS index release But even here, the official pages stop short of showing how much those patents changed profits, wages or economy-wide efficiency. That is why the 16 October funding bulletin is useful as a companion, not as proof of outcome: it reported 2025 R&D spending of 39288.2亿元, up 8.2%, with R&D intensity at 2.80% and basic research spending up 13.3% to 2834.6亿元, or 7.21% of the total. R&D funding interpretation
The funding bulletin also clarifies who and where the money sits. Enterprises performed 30394.4亿元 of R&D, equal to 77.4% of the national total, and the Beijing-Tianjin-Hebei region, the Yangtze River Delta and Guangdong together accounted for 58.8% of national R&D spending in 2025. R&D funding interpretation That supports the input side of the innovation index and hints at strong regional concentration, but it does not identify which provinces or firms drove the rise in the national innovation score. The index release itself does not provide provincial breakdowns, and some component indicators apply only to above-scale industrial enterprises. NBS index release
The 20 October GDP release adds macro context, but on a different clock. It covers the third quarter and first three quarters of 2026, not the 2025 innovation year. The bureau’s preliminary figures showed GDP growth of 4.5% in the third quarter and 4.6% for the first three quarters, with manufacturing up 5.9% and information transmission, software and information technology services up 9.8%, while construction and real estate contracted. Q3 GDP release Those sector patterns can sit alongside the innovation data, but they do not prove that the 2025 rise in tax-benefit use, R&D spending or patent intensity caused 2026 growth. The safest reading is narrower: official data show stronger innovation inputs and selected outputs than measured effectiveness, and the bureau also revised 2022-2024 innovation values, so later economic payoff is still unresolved in the published record. NBS index release