Beijing’s October data window produced two headline numbers on China’s economy that look comparable but answer different questions. On 6 October 2026, the World Bank said it projected China’s 2026 growth at 4.4%, linking that pace to weak domestic demand, a soft labor market and continued property-sector adjustment in an East Asia and Pacific press release (World Bank press release). On 19 October 2026, China’s National Bureau of Statistics said gross domestic product in the first three quarters reached 107,107.1 billion yuan, up 4.6% year on year at constant prices (NBS release).
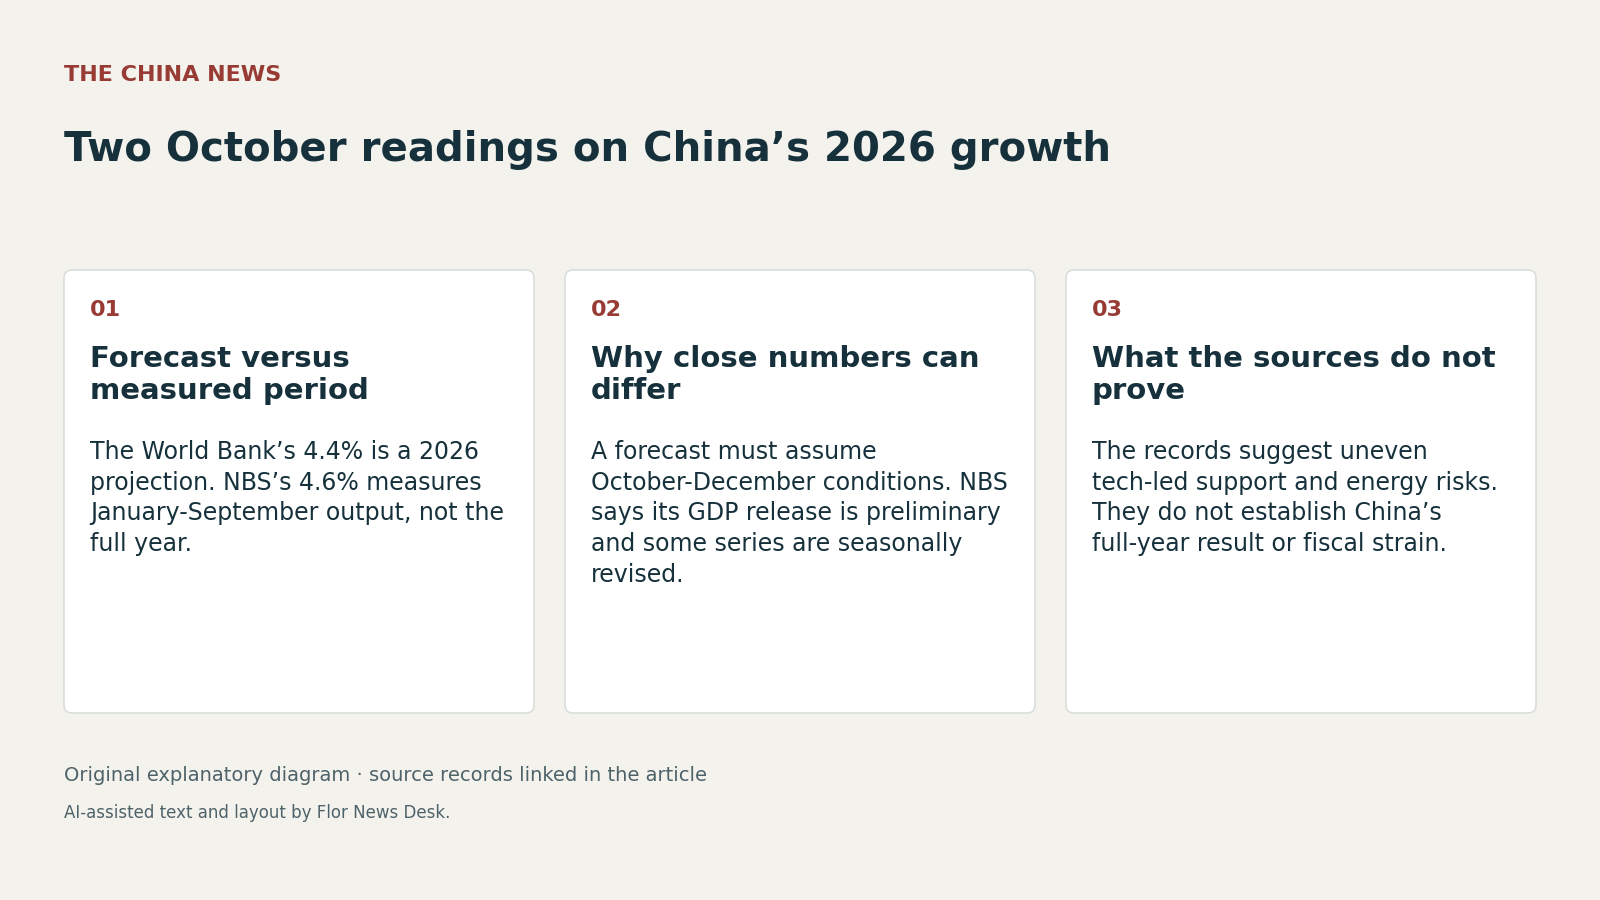
Those figures do not directly contradict each other. The World Bank number is a projection for the whole of 2026, while the NBS number is an official measurement for January through September only. The NBS also broke that period into quarterly year-on-year growth of 5.0% in the first quarter, 4.3% in the second and 4.5% in the third, with third-quarter growth of 1.2% from the previous quarter (NBS release). From those premises, the main analytical point is simple: a 4.6% first-three-quarters result neither proves nor refutes a 4.4% full-year forecast, because the last quarter and any later revisions still matter.
The source record also shows why an external forecast and a domestic statistical release can diverge even when neither is obviously wrong. The World Bank press release provides the China forecast and qualitative explanation, but not the underlying country methodology on that page (World Bank press release). The accompanying East Asia and Pacific Economic Update page, published in October 2026, is more thematic and regional than country-specific in the retrieved text (World Bank publication page). The NBS, for its part, says the GDP figure is based on preliminary estimates and notes seasonal-adjustment revisions and changing statistical coverage for some series (NBS release). That means the comparison is between different time horizons and different types of evidence, not a single scoreboard.
What makes the World Bank update more than a forecasting exercise is its regional argument about artificial intelligence. The publication page says East Asia and Pacific growth is expected to average 4.4% a year in 2026-28, and that production of AI-related goods is supporting economies linked to those supply chains while AI use in the region remains below advanced-economy levels (World Bank publication page). The press release adds that only 13% of jobs in the region fall into a complex-thinking and judgment category, versus 39% in advanced economies, and says policy priorities include wider adoption, local adaptation and state use and regulation of AI (World Bank press release). The analytical implication for China is narrower than broad claims about an AI boom: the source set supports the idea of uneven gains, concentrated in supply chains and adopters, not a verified economy-wide productivity jump.
China’s own October data point in a similar direction, but only indirectly. The NBS said value added in industrial enterprises above designated size rose 5.3% in the first three quarters, while equipment manufacturing increased 10.2% and high-tech manufacturing 14.3%. It also said investment in intellectual property products rose 9.3% and investment in high-tech industries 4.9%, even as fixed-asset investment excluding rural households fell 7.2% (NBS release). Read together, those numbers are consistent with support from specific technology-intensive segments rather than uniformly strong domestic demand. But the NBS release does not isolate AI spending or AI output, so that interpretation remains analysis, not a measured finding.
The regional risks in the World Bank material matter for China’s external links as much as for its domestic outlook. The publication page warns of prolonged high energy prices, spillovers from a slowdown in AI investment and related financial strains, while also noting that high energy costs are weighing on Pacific Island economies (World Bank publication page). Meanwhile, the NBS said China’s goods trade in the first three quarters totaled 39,939.9 billion yuan, up 18.8%, with exports up 16.4% and imports up 22.3% (NBS release). That does not prove a coming slowdown, but it does show why China and its trading partners would feel changes in AI-related demand or energy costs through supply chains rather than through one headline GDP figure alone.
The prudent reading, then, is limited. The World Bank offered an October 2026 projection and a regional risk map; the NBS offered a preliminary January-September measurement. These records are enough to explain why 4.4% and 4.6% can coexist, and enough to suggest that technology-linked sectors are carrying more of the weight than the whole economy. They are not enough to establish China’s full-year 2026 result, the scale of any AI productivity gain, or any province-level fiscal strain, which this source set does not document (NBS release; World Bank publication page).