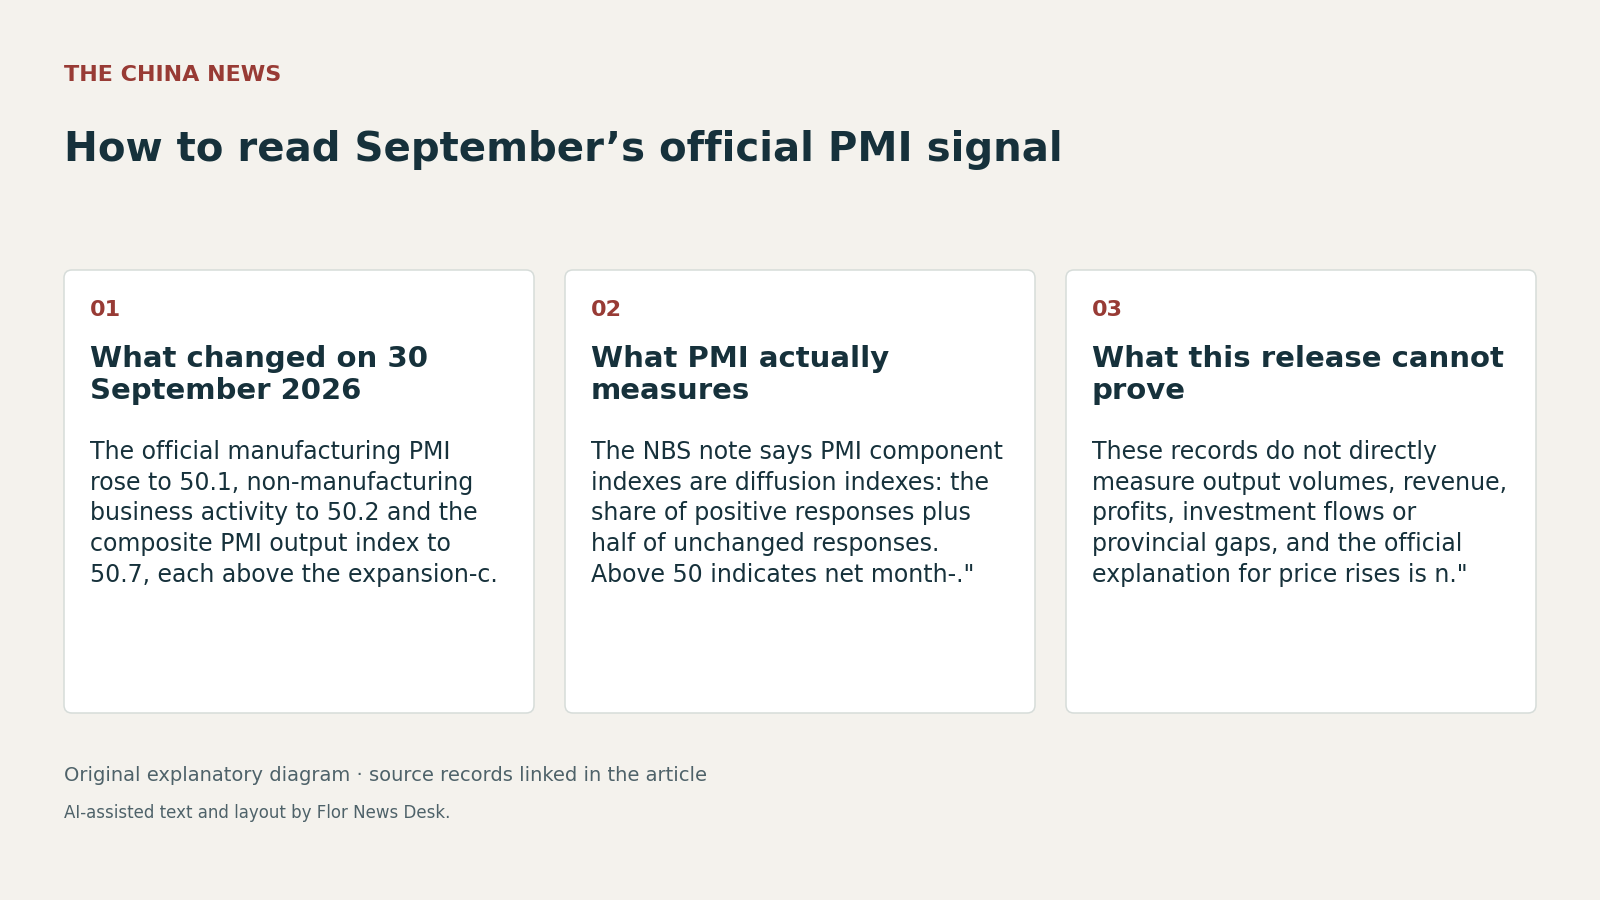

In Beijing on 30 September 2026, the National Bureau of Statistics Service Survey Center and the China Federation of Logistics and Purchasing reported that China’s manufacturing PMI rose to 50.1, the non-manufacturing business activity index rose to 50.2 and the composite PMI output index rose to 50.7. All three were above the 50 threshold that the release uses to indicate expansion from the previous month. That makes the release a timely official read on September sentiment across manufacturing and services, but not a direct tally of output, revenue or profits. September PMI release
The reader question is what that change actually tells us. The official August industrial-production release, published on 16 September 2026, said value added at industrial enterprises above the designated size rose 5.2 percent year on year in August and 0.54 percent month on month after seasonal adjustment. Manufacturing value added rose 6.1 percent and high-technology manufacturing 16.7 percent. Those figures describe production among larger industrial firms. They do not cover services, so they are not a like-for-like comparison with non-manufacturing PMI. August industrial production release
The September PMI widens the lens, but it does so through a survey method. The statistics bureau’s note says the component indexes are diffusion indexes calculated as the share of positive responses plus half the share of unchanged responses. A reading above 50 therefore signals that improvement outweighed deterioration in net terms relative to August. It does not show by how much factory output or service activity increased in volume terms. The release says the survey covers 3,200 manufacturing samples across 31 industry divisions and 4,300 non-manufacturing samples across 43 industry divisions. September PMI release
Inside manufacturing, the details were mixed. The production sub-index rose to 51.7 and new orders were 50.5, both above the threshold. Employment, however, remained below it at 48.4. Larger manufacturers stayed in expansion at 50.6, while medium-sized and small manufacturers, at 49.7 and 48.9, were still below 50 despite improving from August. That is why the headline return to expansion matters less as a claim about strength than as a sign that more parts of the sample improved than worsened. September PMI release
The official commentary adds a sector map, but it remains the bureau’s own interpretation rather than independent verification. Huo Lihui, chief statistician at the National Bureau of Statistics Service Survey Center, said 12 of 21 surveyed manufacturing industries were above 50 in September, four more than in August. Huo also said equipment manufacturing, high-technology manufacturing and consumer-goods manufacturing were in expansion, while the high-energy-consuming industry remained below 50 at 48.0. In non-manufacturing, Huo said construction rose to 50.3, the highest level so far in 2026, and services also returned to expansion at 50.2. NBS commentary
Price signals are another reason to read the release carefully. Huo said the manufacturing purchase volume index rose to 51.0, while the input-price and ex-factory price indexes climbed to 60.8 and 54.0. The same commentary attributed that rise to recent increases in international commodity prices and stronger demand in some industries, with oil-related and chemical sectors particularly elevated. Those are institutional explanations from the NBS commentary, not independently verified findings in this source set, and the records do not establish the precise weight of each factor. NBS commentary
So the 30 September PMI release is most useful as a breadth signal. It suggests that official survey measures improved across a wider slice of the economy than the August large-firm industrial data can show on their own, and that non-manufacturing no longer sat below the 50 line. It still does not establish revenue, profits, provincial divergence, investment flows or the durability of the turn. Those questions need later hard-data releases to test whether September’s broader survey improvement translated into measurable output and spending. September PMI release August industrial production release